
1. The Dashboard Looks Great. The P&L Doesn't.
The average franchised new-car dealership spent $543,539 on advertising in 2024, or approximately $705 per new vehicle sold (NADA Data, 2024). That same dealership likely received a monthly marketing report showing thousands of clicks, hundreds of leads, and a cost per lead that looks reasonable on paper. And yet, at the end of the month, gross profit did not move. Units did not move. The marketing meeting felt productive, but the P&L told a different story.
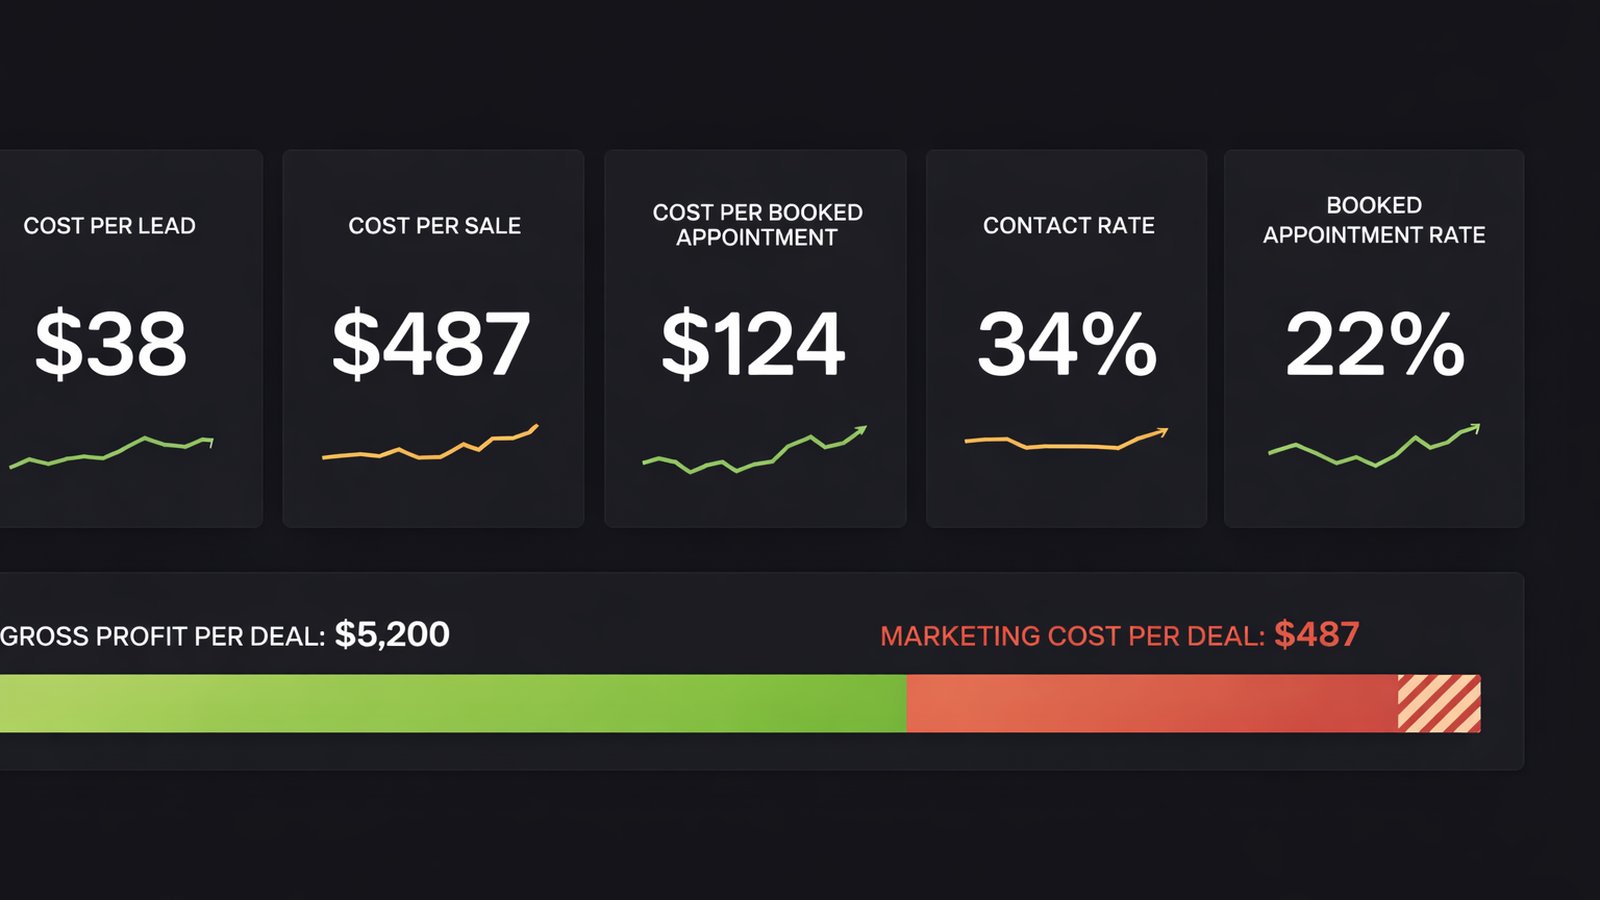
This is the most common disconnect in dealership marketing. The metrics that agencies report — impressions, clicks, leads, cost per lead — are activity metrics. They measure what the marketing did. They do not measure what the marketing produced. A channel delivering 300 leads at $25 CPL looks strong in a dashboard. But if those 300 leads convert to 8 sales at $1,200 average front-end gross, the actual marketing contribution is $9,600 in gross profit against $7,500 in ad spend — a 1.28x return before you account for BDC labor, CRM costs, and the opportunity cost of 292 leads that consumed staff time and produced nothing. Understanding where your $20K is actually going starts here.
The metric that matters is not cost per lead. It is cost per sale, weighted by gross profit. This article explains how to calculate it, why most dealerships cannot currently calculate it, and what to do about it.
2. Leads Do Not Equal Sales
The Conversion Funnel Reality
Not all leads are created equal. The industry-wide conversion rate from internet lead to vehicle sale ranges from 8-12% for well-managed BDC operations (Demand Local, 2025). That means for every 100 leads your marketing generates, 88-92 will not buy a car from you. Some were never real buyers. Some bought elsewhere. Some were price-shopping with no intent to purchase. Some were lost because your BDC took 17 hours to respond — the current industry average for after-hours leads (NADA/Better Car People, 2025).
Here is where the math gets uncomfortable:
| Scenario | Channel A | Channel B |
|---|---|---|
| Leads generated | 200 | 80 |
| Cost per lead | $25 | $60 |
| Total ad spend | $5,000 | $4,800 |
| Lead-to-sale conversion | 5% | 15% |
| Vehicles sold | 10 | 12 |
| Average front-end gross | $1,500 | $2,800 |
| Total gross profit | $15,000 | $33,600 |
| Cost per sale | $500 | $400 |
| ROI (gross profit / ad spend) | 3.0x | 7.0x |
Channel A looks better in every marketing dashboard: more leads, lower CPL, lower total spend. Channel B looks better on the P&L: more units, higher gross, lower cost per sale, and dramatically higher ROI. If your marketing meeting only reviews Channel A's metrics, you will increase budget to the wrong channel.
Why Lead Quality Varies by Channel
Different marketing channels attract buyers at different stages of commitment and with different purchase profiles:
| Channel | Typical CPL | Lead-to-Sale Rate | Average Gross | Cost Per Sale |
|---|---|---|---|---|
| Organic search / SEO | $0 (excluding content cost) | 10-15% | $2,000-$3,000 | $200-$400 |
| Google Search (non-branded) | $35-$90 | 8-12% | $1,800-$2,500 | $500-$700 |
| Google VLAs | $25-$45 | 10-15% | $2,000-$2,800 | $300-$500 |
| Meta Lead Forms | $15-$40 | 4-8% | $1,200-$2,000 | $400-$800 |
| Third-party leads (AutoTrader, Cars.com) | $20-$35 | 3-6% | $1,000-$1,800 | $800-$1,200 |
Source: Compiled from Demand Local, 2025; DealerSmart, 2026; NADA Data, 2024
The channel with the lowest cost per lead is often the channel with the lowest gross per deal and the lowest conversion rate. This is not a coincidence — it is why a full-funnel advertising strategy matters more than any single channel. Low-friction lead forms capture high-volume, low-intent inquiries. High-intent channels (search, VLAs) cost more per lead but produce buyers who convert faster and negotiate less.
3. The Metrics That Actually Matter
The Three Numbers for Your Marketing Meeting
Every monthly marketing meeting should start and end with three numbers:
1. Cost Per Sale (CPS)
Total marketing spend divided by total vehicles sold attributable to marketing. The NADA industry average is approximately $705 per new vehicle sold (NADA, 2024). Dealerships spending $722 per vehicle sold on advertising in H1 2025 were at benchmark (Demand Local, 2025).
Cost Per Sale = Total Marketing Spend / Vehicles Sold (attributed to marketing)
2. Marketing-Attributed Gross Profit
The total front-end and back-end gross profit from vehicles sold to customers who entered the funnel through a marketing channel. This is the number that connects marketing to the P&L.
Marketing-Attributed Gross = Sum of (Gross Profit per deal) for all marketing-sourced sales
3. Marketing ROI Ratio
Gross profit generated divided by marketing spend. A ratio of 5:1 or higher means every dollar of marketing spend generated five dollars of gross profit.
Marketing ROI = Marketing-Attributed Gross Profit / Total Marketing Spend
What These Numbers Tell You
| ROI Ratio | Interpretation | Action |
|---|---|---|
| Under 3:1 | Marketing is underperforming | Audit channel mix, lead quality, and BDC conversion |
| 3:1 to 5:1 | Acceptable but room to improve | Optimize channel allocation, improve lead handling |
| 5:1 to 8:1 | Strong performance | Scale spend in top-performing channels |
| 8:1+ | Excellent | You may be underinvesting — test higher budgets |
4. How to Calculate True Cost Per Sale
Step 1: Define "Marketing-Sourced"
Before you can calculate cost per sale, you need a consistent definition of which sales are marketing-sourced. Most CRMs allow lead source tracking, but the data is only as good as what your team enters. Establish clear rules:
- Marketing-sourced: Customer first entered the CRM through a digital lead (form fill, phone call from ad, chat from website, text from FBMP listing).
- Not marketing-sourced: Repeat customer, service-to-sales, referral, walk-in with no prior digital touchpoint, fleet/wholesale.
Be conservative. It is better to undercount marketing-sourced sales than to inflate them with walk-ins who would have come regardless.
Step 2: Track Source Through to Close
The breakdown happens between lead creation and deal closing. A lead enters the CRM as "Google Search" but by the time it is a closed deal 18 days later, nobody updates the source. According to Brian Pasch of PCG Digital, 92% of vehicle sales remain untraceable in dealership CRM systems — the fragmented operating system problem in its starkest form — meaning dealerships cannot connect their marketing investments to actual sales outcomes (PCG Digital, 2024).
The fix: Implement a CRM process where the original lead source is locked at creation and carries through to the deal record. The salesperson should not be able to change or remove it. This is a CRM configuration change, not a behavioral one — which is why it works.
Step 3: Calculate by Channel
Once you have source-tracked deals, calculate cost per sale by channel:
Channel CPS = Channel Ad Spend / Channel-Sourced Vehicle Sales
Then weight by gross:
Channel ROI = Channel-Sourced Gross Profit / Channel Ad Spend
This gives you a clear picture of which channels produce profitable sales, not just leads. Concentrating spend on your three pillar models makes this calculation even more revealing.
Step 4: Include Hidden Costs
True cost per sale should include:
- Ad spend — The direct media cost
- Agency/vendor fees — Management fees, platform costs
- BDC labor allocation — The portion of your BDC payroll spent handling marketing leads
- Technology costs — CRM, chat tools, call tracking, attribution platforms
A channel with a $40 CPL and a 10% close rate has a $400 CPS on ad spend alone. Add $100 in BDC labor per sale, $50 in technology costs, and $75 in agency fees, and the true CPS is $625. This number is what belongs on your P&L analysis.
5. Attribution Models That Work for Dealerships
The Problem with Last-Click
Most dealership marketing reporting defaults to last-click attribution: the last touchpoint before conversion gets 100% of the credit. If a buyer clicked a Google Search ad before submitting a lead form, Google Search gets full credit — even if that buyer first discovered your dealership through a Meta video ad two weeks earlier, then visited your website three times via organic search.
Last-click attribution systematically overvalues bottom-funnel channels (search, retargeting) and undervalues top-funnel channels (awareness, social, video). Cox Automotive's analysis found that Autotrader influenced 55% of sales under multi-touch attribution versus just 21% under last-touch — a 2.6x undervaluation (Cox Automotive, 2023).
Attribution Models Ranked by Accuracy
| Model | How It Works | Accuracy for Dealers | Complexity |
|---|---|---|---|
| Last-click | 100% credit to final touchpoint | Low — overvalues search | Simple |
| First-click | 100% credit to first touchpoint | Low — overvalues awareness | Simple |
| Linear | Equal credit to all touchpoints | Medium — fair but oversimplified | Medium |
| Time-decay | More credit to touchpoints closer to conversion | Medium-High — reflects buyer journey | Medium |
| Data-driven (DDA) | Machine learning assigns credit based on actual conversion patterns | Highest — learns from your data | High |
| Offline CRM match | Imports CRM sales data into ad platforms | Highest for cost-per-sale | High |
The Practical Recommendation
For most dealerships, a perfect attribution model is not achievable today. The practical approach is:
- Use Google's data-driven attribution (available in Google Ads) for your Google campaigns. It is free, automatic, and significantly more accurate than last-click.
- Track branded search lift as a proxy for Meta's contribution. If branded search volume increases after launching Meta awareness campaigns, Meta is driving consideration.
- Import offline conversions from your CRM into Google Ads and Meta. This tells the algorithms which leads actually purchased, enabling optimization toward sales — not just leads.
- Accept imperfection. You will never attribute every sale perfectly. The goal is directionally accurate allocation that improves over time, not a perfect model that never gets implemented.
6. What Your Marketing Meeting Should Look Like
The Current State (at Most Dealerships)
The agency presents a PDF or dashboard showing:
- Impressions (millions!)
- Clicks (thousands!)
- Leads (hundreds!)
- Cost per lead ($30! Down from $35!)
- A few screenshots of top-performing ads
The GM nods, asks a vague question about Facebook, and everyone moves on. No one connects the marketing data to the DMS. No one knows if the 400 leads produced 20 sales or 40 sales. No one can answer the question: "Did this month's marketing make us money?"
What It Should Look Like
A 30-minute monthly meeting with one dashboard that shows:
Page 1: Sales Impact
| Metric | This Month | Last Month | 3-Month Avg |
|---|---|---|---|
| Marketing-sourced sales | X units | Y units | Z units |
| Marketing cost per sale | $XXX | $XXX | $XXX |
| Marketing-attributed gross | $XXX,XXX | $XXX,XXX | $XXX,XXX |
| Marketing ROI ratio | X.X:1 | X.X:1 | X.X:1 |
Page 2: Channel Performance
| Channel | Spend | Leads | Sales | CPS | Gross | ROI |
|---|---|---|---|---|---|---|
| Google Search | $X,XXX | XX | XX | $XXX | $XX,XXX | X.X:1 |
| Google VLAs | $X,XXX | XX | XX | $XXX | $XX,XXX | X.X:1 |
| Google PMax | $X,XXX | XX | XX | $XXX | $XX,XXX | X.X:1 |
| Meta Ads | $X,XXX | XX | XX | $XXX | $XX,XXX | X.X:1 |
| Organic | $0 | XX | XX | $0 | $XX,XXX | N/A |
Page 3: Decisions
Based on channel-level ROI:
- Which channel should get more budget next month?
- Which channel should get less?
- Where is the BDC dropping the ball on lead follow-up?
- What is the conversion bottleneck — lead volume, lead quality, or BDC execution?
This meeting takes 30 minutes because the data is pre-calculated and the conversation focuses on decisions, not presentations. If your marketing meeting is an hour of an agency explaining what impressions are, you need a different meeting — or a different agency.
7. Adversarial Review: Top 5 Holes in This Article
Hole 1: "92% of sales being untraceable sounds made up."
It is sourced from Brian Pasch (PCG Digital, 2024), one of the most cited voices in automotive digital marketing. The figure refers to the inability of most dealer CRM systems to connect a closed deal to its originating marketing channel with certainty. Walk-ins, phone calls that are not tracked, and CRM data entry failures all contribute. The number is directionally correct even if the exact percentage varies by dealership.
Hole 2: "You assume dealers have CRM data clean enough to do this analysis."
Most do not. That is the point. The article recommends locking lead source at CRM entry and importing offline conversions — both of which are achievable CRM configuration changes. The barrier is not technology; it is process discipline. A dealer who implements these two changes will have usable data within 90 days.
Hole 3: "Gross profit per deal varies wildly — your channel comparison table is oversimplified."
It is. Gross profit is influenced by negotiation, trade-in, F&I, and vehicle mix — not just the marketing channel. The table reflects directional patterns, not deterministic relationships. The underlying argument — that lead source correlates with buyer intent and deal quality — is well-supported by industry data from NADA, Cox Automotive, and Demand Local.
Hole 4: "Service department gross is 49% of total dealer gross — why doesn't this article cover service marketing ROI?"
Because service marketing has a fundamentally different funnel and metrics set (customer pay ROs, retention rate, average RO value). It warrants its own analysis. This article is specifically about variable operations marketing ROI because that is where most discretionary ad spend goes and where the P&L disconnect is most acute.
Hole 5: "You recommend a 30-minute marketing meeting — that's not realistic for a multi-franchise group."
For a single-point store, 30 minutes is sufficient with the right dashboard. Multi-rooftop groups may need a 60-minute aggregate review plus 15-minute per-store breakouts. The principle holds: lead with sales impact, not activity metrics. The meeting length should match the complexity of the operation, but the format should never start with impressions.