
The Short Answer
The average franchise dealership in America spent $543,539 on advertising in 2024, a 3% increase from the prior year, with 73% now allocated to digital channels (NADA Annual Financial Profile, 2024; Demand Local, 2025). That works out to roughly $45,000 per month, or $722 per vehicle sold in H1 2025 (Inside Radio, 2025). Yet most GMs cannot draw a clean line from that spend to units moved — which is exactly the gap we address in how to measure real marketing ROI. The problem is not the budget -- it is allocation.
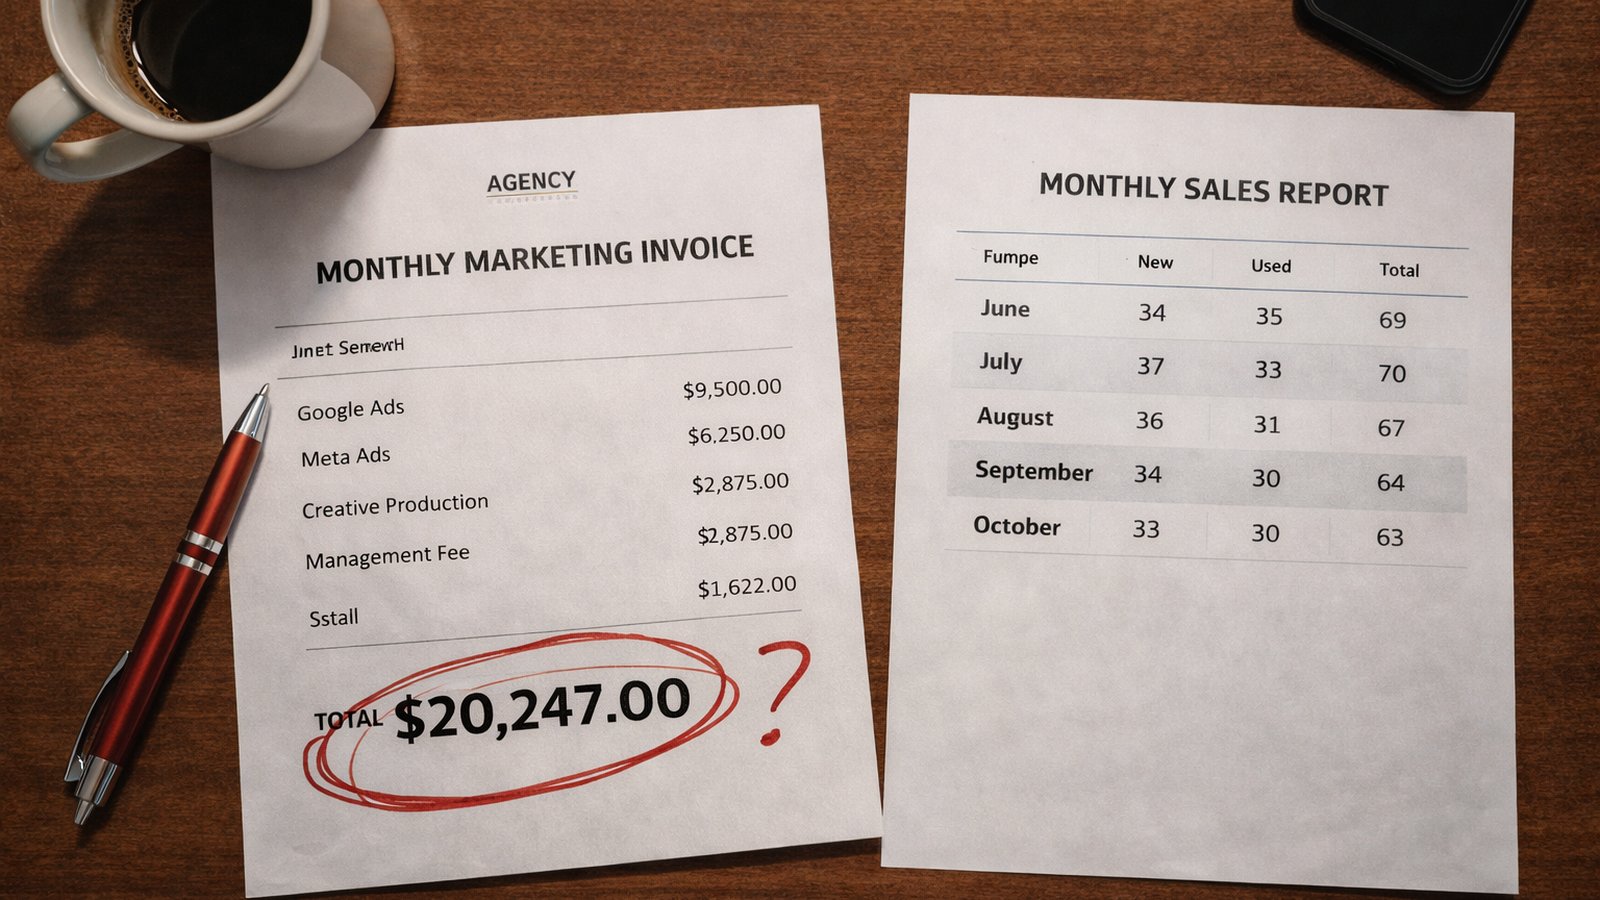
1. The $20K Month (And the $45K Month)
| Metric | Amount | Source |
|---|---|---|
| Average annual advertising spend (franchise dealer) | $543,539 | NADA, 2024 |
| Average monthly spend | ~$45,295 | Derived from NADA, 2024 |
| Year-over-year increase | +3% | NADA, 2024 |
| Ad cost per vehicle sold (H1 2025) | $722 | Inside Radio / Borrell Associates, 2025 |
| Digital share of total ad budget | 73% | NADA, 2024 |
| Total U.S. dealer ad spending (H1 2025) | $4.8 billion | Inside Radio / Borrell Associates, 2025 |
| NADA recommended marketing allocation | 6-7% of gross profit | NADA guideline |
Whether your budget is $20K or $60K per month, the same structural problems apply. The question is not "are we spending enough?" but "is what we are spending producing measurable results in appointments and sales?"
2. Where the Money Actually Goes: A Breakdown
Typical $45,000/Month Digital Budget Allocation
| Channel | Typical % | Monthly Spend | What It Should Do |
|---|---|---|---|
| Google Search (branded + non-branded) | 30-35% | $13,500-$15,750 | Capture in-market shoppers |
| Google Performance Max / Display | 15-20% | $6,750-$9,000 | Automated campaigns across Google properties |
| Meta (Facebook + Instagram) | 20-25% | $9,000-$11,250 | Awareness, retargeting, inventory ads |
| Third-party listings (Cars.com, AutoTrader, CarGurus) | 10-15% | $4,500-$6,750 | Inventory exposure to cross-shopping buyers |
| OEM co-op mandated spend | 5-10% | $2,250-$4,500 | Manufacturer-required programs |
| Video / CTV / YouTube | 5-10% | $2,250-$4,500 | Brand awareness, pre-roll, video reach |
| Other (email, direct mail, sponsorships) | 5% | $2,250 | Varies |
3. Five Ways Dealers Waste Ad Spend
Waste #1: Over-Bidding on Branded Search
This is the single most common source of wasted ad spend in dealership marketing. Branded search means bidding on your own dealership name in Google Ads. A KoreTechX analysis (2025) found that dealerships routinely waste budget on Google Ads by bidding on their own brand name and receiving clicks from people who were already navigating to their site.
The math: If 30% of your Google Search budget is branded search ($4,000-$5,000/month), and the vast majority of those clicks would have reached your site organically, you are spending thousands per month to capture traffic that was already yours.
Waste #2: Broad Targeting That Drives Unqualified Traffic
DealerTalk (2025) documented that dealerships commonly waste budget on low-intent searches: "cheap used cars," "[brand] problems," "[brand] recall," and service-related queries that land on sales pages.
The industry benchmark for Google Ads conversion rate in automotive is 8-12%, with top performers reaching 15-20%. If your conversion rate is below 8%, broad targeting is likely the cause.
Waste #3: Untracked Channels Running on Autopilot
NADA data shows that 27% of dealership ad budgets still go to non-digital channels (NADA, 2024). For a $45,000/month budget, that is $12,150/month -- $145,800 per year -- with limited or no conversion tracking.
Waste #4: Creative Fatigue Dragging Down Paid Social
When the same ad runs for 90+ days without refresh, completion rates drop, CPMs rise, and cost-per-lead inflates -- sometimes by 50% or more. Investing in original campaign creative is not a luxury — it is a performance lever. The signal: If your Meta CPL has increased 30%+ over 90 days without a corresponding market shift, creative fatigue is almost certainly the cause.
Waste #5: Misaligned Third-Party Listing Spend
A $6,000/month CarGurus subscription with poorly photographed vehicles and incomplete descriptions is significantly less effective than a $3,000/month subscription with 30+ professional photos per vehicle and complete specs. The spend itself is not waste -- the platforms generate real traffic. The waste is in paying premium rates while providing sub-premium content.
4. The Agency Incentive Problem
Most dealership marketing agencies charge based on a percentage of ad spend -- typically 10-20% of the managed media budget. This creates a structural misalignment.
| Scenario | Dealer's Interest | Agency's Interest (% of Spend) |
|---|---|---|
| Budget could be reduced by $5K/month with same results | Reduce spend, improve ROI | Maintain spend (losing $500-$1,000/month in fees) |
| New channel requires $3K test budget | Test cautiously, measure | Enthusiastic -- adds $300-$600/month in fees |
| Campaign is underperforming | Pause and reallocate | Reluctant to reduce managed spend |
| Budget increase from $30K to $50K | Only if ROI supports it | Immediate fee increase |
According to a 2025 Gartner CMO Spend Survey, 39% of marketing leaders planned to decrease external agency spending in 2025, with many citing a desire to strengthen oversight and accountability.
5. What a Right-Sized Budget Looks Like
The Right-Sizing Framework
Step 1: Establish your target cost per sale. Work backward from gross profit. If your average front-end gross is $3,000 per new vehicle and $2,500 per used vehicle, and your blended target is a 10:1 return on ad spend, your target cost per sale is $275-$300.
Step 2: Audit current spend against outcomes. For every channel, calculate: spend / appointments generated / units attributable. Any channel where cost per sale exceeds your target -- and has exceeded it for 90+ days -- is a candidate for reduction.
Step 3: Allocate across the Three Pillar Model.
| Pillar | Purpose | Recommended Allocation |
|---|---|---|
| Acquisition | New customers who have never bought from you | 50-60% of budget |
| Retention | Existing customers due for service, trade-in, or repurchase | 20-25% of budget |
| Activation | Dormant leads, equity mining, unconverted web leads | 15-25% of budget |
6. The Three Pillar Reallocation: A Before-and-After
Before: Typical Allocation
| Line Item | Monthly Spend | Notes |
|---|---|---|
| Google Search (60% branded) | $14,000 | Branded search eating budget |
| Google PMax | $6,000 | Running on autopilot |
| Meta ads (same creative 4 months) | $8,000 | Fatigued creative, rising CPL |
| CarGurus Premium | $5,000 | Poor photos, incomplete listings |
| Radio (untracked) | $3,000 | Legacy buy, no attribution |
| OEM co-op | $2,000 | Mandatory |
| Misc (sponsorships, print) | $2,000 | No tracking |
| Total | $40,000 | Cost per sale: ~$800 |
After: Three Pillar Reallocation
| Line Item | Monthly Spend | Pillar | Change |
|---|---|---|---|
| Google Search (branded reduced to 10%) | $12,000 | Acquisition | -$2,000, better targeting |
| Google PMax (with audience signals) | $5,000 | Acquisition | -$1,000, optimized |
| Meta ads (monthly creative refresh) | $8,000 | Acquisition + Activation | Same spend, better creative |
| CarGurus (standard tier + better content) | $3,000 | Acquisition | -$2,000, improved listings |
| Email/SMS campaigns (existing database) | $2,000 | Retention | NEW |
| Equity mining / dormant lead reactivation | $3,000 | Activation | NEW |
| OEM co-op | $2,000 | Acquisition | Mandatory |
| Video production (monthly refresh) | $2,000 | Acquisition | NEW |
| YouTube pre-roll (local targeting) | $1,500 | Acquisition | NEW |
| Measurement / call tracking / attribution | $1,500 | All | NEW |
| Total | $40,000 | Target cost per sale: $400-$500 |
Same total budget. Fundamentally different allocation. The $7,000 freed from branded search waste, untracked legacy channels, and premium listing overpayment funds new capabilities in Retention, Activation, video, and measurement.
7. The Hardest Part: Saying No
The biggest obstacle to right-sizing a marketing budget is not strategy -- it is inertia. Dealers continue spending on channels because they always have, because the rep relationship is long-standing, because "we think it works" even without data.
Saying no to a $3,000/month radio buy that has run for five years feels risky. Running a $2,000/month equity mining campaign that has never been tried feels risky. But one of those risks is measurable and the other is not. The measurable risk is always the better bet.
The same applies to agencies. If your agency's billing model rewards spend increases, they will not proactively recommend budget cuts -- even when the data supports them. The solution is to work with an agency whose compensation is tied to outcomes, not to the size of your budget. That accountability model is why our clients stay.